What are the stripes?
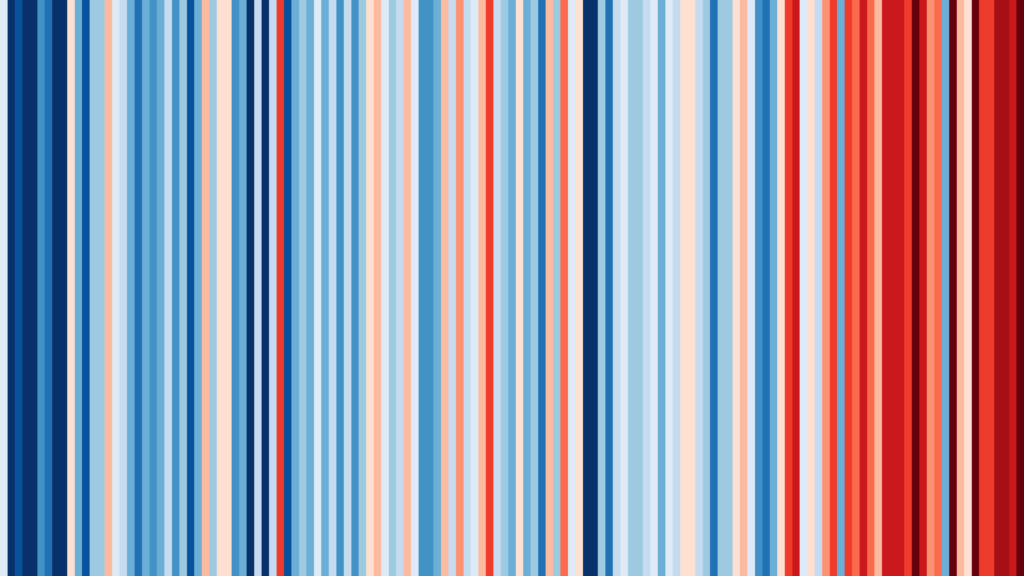
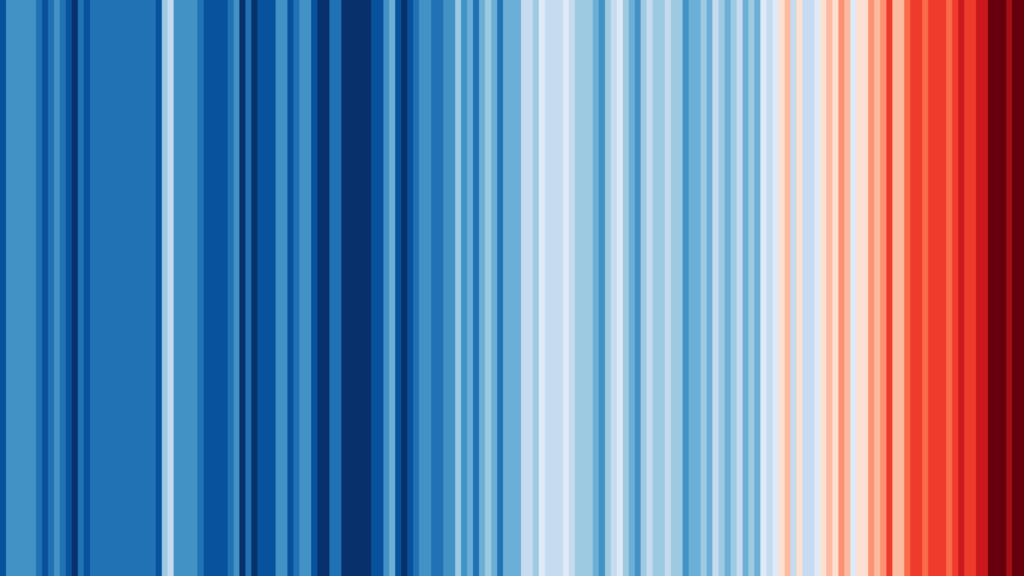
No words. No numbers. No graphs. Just a series of vertical coloured bars, showing the progressive heating of our planet in a single, striking image. The climate stripes were created by Professor Ed Hawkins at the University of Reading in 2018. They show clearly and vividly how global average temperatures have risen over nearly two centuries,
Climate stripes for England, 1884 to 2020:

Global Climate Stripes, 1850 to 2020:

CC 4.0 License, copyright Professor Ed Hawkins (University of Reading)
Climate Stripes website: click here.
